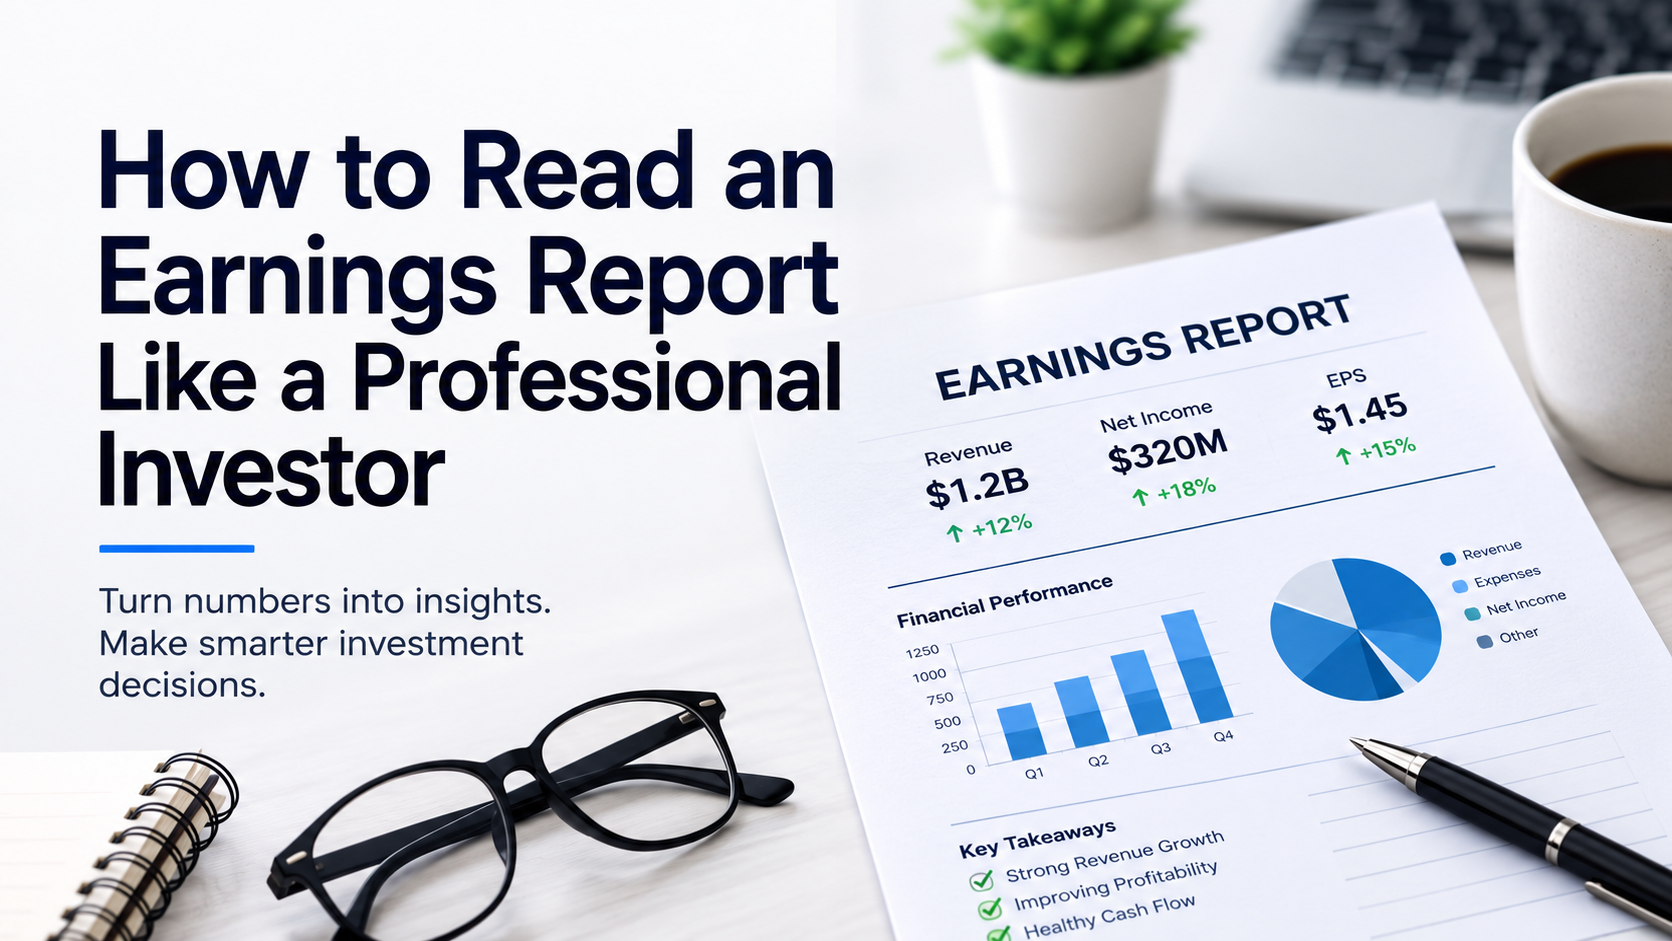

Have you ever wondered what makes stock prices move? Every day, share prices rise and fall based on a variety of factors. One of the most important drivers is a company’s earnings report. Publicly listed companies release quarterly and annual earnings reports to provide investors with an update on their financial performance and future outlook. If you’re new to investing, I recommend first reading our Investing in Stocks: A Beginner’s Guide to Building Long-Term Wealth. It explains the fundamentals of investing before showing you how to read an earnings report. Understanding both concepts will help you make more informed investment decisions.
What is an Earnings Report?
An earnings report is a financial update that publicly listed companies release every quarter (every three months) and annually at the end of their fiscal year. These reports summarize a company’s financial performance and provide investors with valuable insights into its future prospects, opportunities, and potential risks.
Most publicly listed companies publish their earnings reports in the Investor Relations section of their websites. Investors can also access official company filings through the SEC’s EDGAR database (for U.S. companies) or SEDAR+ (for Canadian companies).
Learning how to read an earnings report is an essential skill for every investor. Once you understand the key financial metrics, evaluating a company’s financial performance becomes much easier.
Key Metrics Every Investor Should Understand
| Metric | What it tells you |
| Revenue | Is the business growing? |
| Gross Margin | Is the company becoming more efficient? |
| Operating Margin | Is management controlling operating costs? |
| Net Income | Is the company profitable? |
| Free cash flow | Is the business generating real cash? |
| EPS | How much profit belongs to each Share |
| Guidance | What management expects next |
How to Read an Earnings Report: What Investors Should Look For
Investors should review Revenue growth compared with management guidance and the same quarter of the previous year.
EPS growth shows profit per share unit and helps investors compare different businesses. A rising EPS over time indicates a healthy, growing business. Gross Margin is another important measure for investors as it indicates how well a business is managing its gross costs with
Revenue growth alone does not generate shareholders’ value, it’s the residual that is tied to shareholders’ wealth. Similarly Operating Income is another important metric. When Sales, general and admin expenses are taken into account, Gross margin becomes Operating Income. An improved Operating income indicates how well a business manages its operating expenses.
Last but not the least, Free Cash flow measure. Cash is king. Even profitable businesses can fail if they are unable to generate sufficient cash to fund operations, invest in growth, or meet their financial obligations. Net Income tells what a business has earned , but free cash flow explains how much of that income is converted to actual cash.
A statement of cash flow shows how strong a business is in its operations which is essentially the life of business. It also shows how much of the remainder is used for investments and financing. A healthy free cash flow indicates the future success of the business and is a very important factor when making investment decisions.
Why Does Future Guidance matter?

Many novice investors keep an eye on earning reports and past financial results.It is important to remember that a stock’s market price reflects expectations of future earnings, not just past financial performance. Therefore, management forward-looking guidance has a significant impact on the share price. Investors should pay close attention to management’s guidance, as it often has a greater impact on share price than the reported results themselves.
A Real-World Example
Lets see the above theory using an example. Imagine stock price of a company is $300, EPS is $8.27, Revenue grew by 12.76% to $450 billion, Gross Margin expanded to 48%, Operating Profit 32% and Net Income reached $122billion
Here is how I would evaluate the company
A nearly 13% increase for a company already generating $450 billion is exceptional.
Gross Margin = 48%
This means:
For every $100 of sales,
- $48 remains after paying production costs.
- $52 was spent producing the product.
A 48% gross margin is very strong for most industries.
If last year it was 45% and now it’s 48%, that’s even better because the company is becoming more efficient.
Operating Margin = 32%
This means after:
- salaries
- marketing
- administration
- R&D
The company still keeps $32 out of every $100 sold.
That’s excellent.
It shows management is controlling expenses
Net Income = $122 billion
Now we know the company isn’t just selling more.
It is actually converting those sales into cash profits.
Net Margin
= 122 / 450
= 27.1%
Meaning every $100 sold becomes $27 profit.
EPS = $8.27
EPS tells us how much profit belongs to one share.
By itself it doesn’t tell us if the stock is expensive.
That’s where valuation comes in.
Price = $300
EPS = $8.27
P/E = Price ÷ EPS
= 300 / 8.27
= 36.3
What does a P/E of 36 mean?
It means investors are paying $36.30 for every $1 of annual earnings.
The next question becomes:
Does this company deserve such a premium?
This is a fantastic business with:
- strong revenue growth,
- expanding margins,
- high profitability,
- excellent earnings quality.
The only caution is valuation. At a P/E of about 36, investors are already paying a premium, so much of the optimism may already be reflected in the share price.
A strong company is not always a strong investment at today’s price. If future earnings continue to grow rapidly, today’s valuation could be justified. If growth slows, the stock could decline even while the business itself remains excellent.
Common Mistakes Beginners make

Many new investors rely on profitability reports and ignore cash positions of the business which is the main energy source for growth. Stock price also moves with market sentiment and headlines which temporarily creates volatility. Reacting to such headlines means locking in losses on temporary movements
Before making any investment decision, ask yourself the following questions:
- Is revenue growing?
- Is profit growing?
- Is cash flow positive?
- Is debt manageable?
- Is management optimistic?
Key Takeaways

- Revenue tells you if the business is growing.
- Margins tell you how efficiently it operates.
- Cash flow tells you if profits are real.
- EPS measures earnings available to shareholders.
- Future guidance often matters more than past results.
Capital Lenses Take
An earnings report is more than a collection of financial numbers—it tells the story of a company’s performance, financial health, and future direction. Knowing how to read an earnings report can help investors make informed decisions based on business fundamentals rather than short-term market noise.
Enjoyed this article? Follow Capital Lenses for practical investing education, market insights, and step-by-step guides designed to help you become a more informed investor.
Disclaimer
The information provided in this article is for educational and informational purposes only and should not be considered financial, investment, tax, legal, or professional advice.
Capital Lenses does not make recommendations to buy, sell, or hold any security or investment. All investments involve risk, including the potential loss of principal. Before making any investment decisions, conduct your own research and consider consulting a qualified financial advisor who can assess your individual circumstances.
While we strive to provide accurate and up-to-date information, no guarantee is made regarding the completeness, accuracy, or reliability of the content. Any reliance you place on the information provided is solely at your own risk.
Written by