Author: Tabasum imtiaz

  • How to Read Financial Ratios: A Practical Guide for Investors  

    How to Read Financial Ratios: A Practical Guide for Investors  

    Learning how to read financial ratios isn’t really about memorizing formulas. It’s about understanding what those numbers are trying to tell you about the business.Years ago, someone handed me a stack of financial statements and said, “just run the ratios and tell me what you think.” I remember staring at that page for a good ten minutes, completely lost. Numbers everywhere. No story. No idea where to even start.

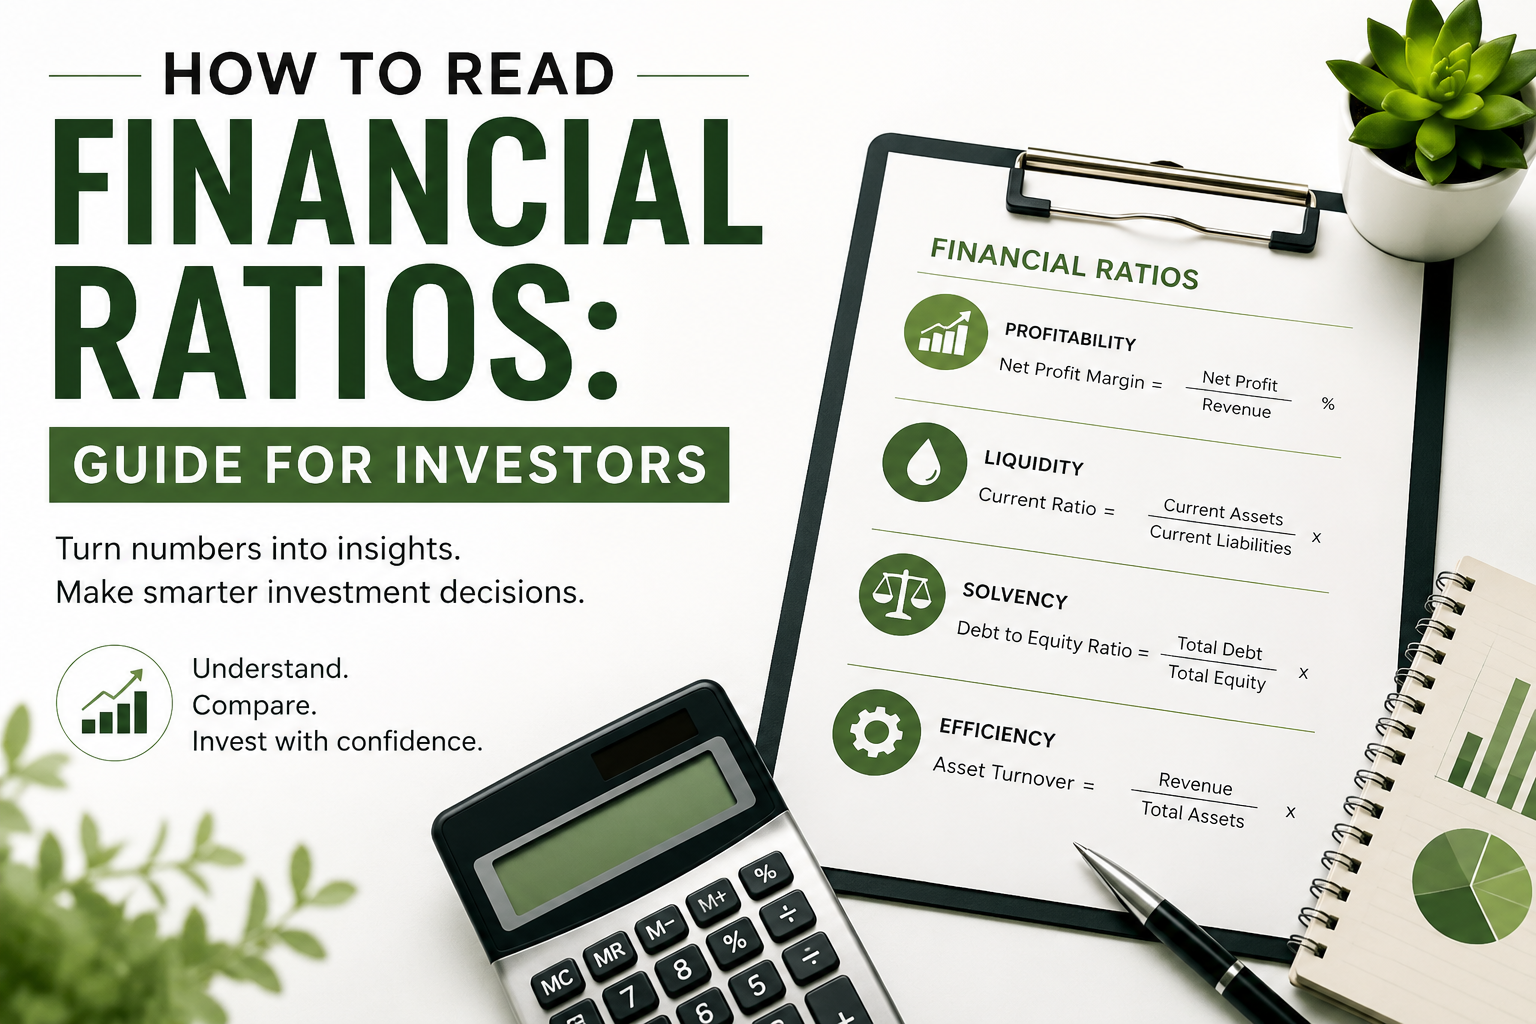
    The easiest way to learn how to read financial ratios is to stop looking at them individually and start asking what each group tells you about the business.

    It took me a while, honestly – years working inside finance teams, closing books month after month, sitting across from executives who wanted the two-minute version of a problem, not the twenty-page one – before ratios stopped feeling like a math test and started feeling like something closer to a conversation. The company is telling you something. You just have to know which numbers to listen to.

    Once that clicked, everything got easier. So here’s my attempt to save you a few of those years. Four categories, some real examples, and none of the textbook jargon that made this stuff so painful to learn in the first place.

    Profitability Ratios: Is the Business Actually Making Money?

    Let’s start here because it’s the fun one, the one everyone gravitates toward first. Fair enough – we all want to know if a company is printing cash or just printing headlines.

    Profitability ratios for financial analysis

    Gross Profit

    Gross profit margin is your starting point. It’s what’s left once you strip out the direct cost of whatever the company sells. Don’t get too excited or too worried by the raw number on its own though. A software company sitting at 80% margins and a grocery chain at 25% aren’t in some kind of race against each other. They’re just different businesses with completely different cost structures. Context does most of the heavy lifting here.

    Net Profit

    Then there’s net profit margin, which is really the number that keeps finance people up at night. This is what survives after everything gets paid – salaries, interest, taxes, the new coffee machine somebody approved without asking. A company can look fantastic on revenue and still produce very little bottom-line profit if this figure is thin or, worse, negative.

    Return on Equity

    My personal favorite is return on equity. It cuts straight to what shareholders actually want to know: for every dollar of shareholders’ equity sitting in the company, how much profit is the business generating?

    A consistently strong ROE can be a sign of an excellent business, but this is one ratio where you need to look underneath the surface. High ROE can also be created by heavy borrowing or a relatively small equity base. That’s why I wouldn’t judge ROE on its own – I’d look at the company’s leverage and compare its ROE with its own history and with similar businesses.

    Here’s a quick way to picture the difference. Say two companies each pull in $10 million in revenue. One runs a 5% net margin, the other 15%. Same size on paper, totally different animals underneath. That second company is converting far more of its sales into profit. The next question is why – stronger pricing power, better cost discipline, a different product mix, or perhaps a fundamentally better business model.

    Liquidity Ratios: Can It Survive the Next Few Months?

    Profitability tells you whether a business is making money. Liquidity tells you whether it can comfortably meet its short-term obligations. I’ve watched companies that looked perfectly healthy on the income statement run into real trouble simply because they couldn’t cover what was due in the short term. Profit and cash are two different things, and this is exactly where that gap gets tested.

    Liquidity ratios for financial analysis

    Current Ratio

    The current ratio is the simplest place to check. It’s current assets divided by current liabilities. If it dips under 1.0, that’s worth investigating – it means, on paper at least, the company has fewer current assets than current liabilities.

    But don’t treat 1.0 as some magical dividing line between a healthy company and a troubled one. Some businesses can operate comfortably with relatively low current ratios because they generate predictable cash, collect from customers quickly, or turn inventory extremely fast. What matters is the nature of the business, its historical trend, and how it compares with similar companies.

    Quick Ratio

    The quick ratio (some people call it the acid-test) is the stricter version. It pulls inventory out of the equation because inventory isn’t always something you can turn into cash on short notice, especially if it’s sitting in a warehouse instead of moving out the door. This ratio is really asking one thing: if liquidity got tight, could the company handle its short-term obligations without relying heavily on selling inventory?

    Picture a retailer heading into a slow stretch with a current ratio of 1.8 but a quick ratio sitting at just 0.6. That gap is telling you something real – a large part of that liquidity cushion is inventory rather than cash or receivables. That isn’t automatically bad for a retailer, but if sales start slowing while inventory keeps building, I’d want to understand what’s happening.

    Solvency Ratios: Is the Debt Load Sustainable?

    This one plays out over years, not quarters. It becomes particularly important when rates climb or the economy turns. Solvency ratios are about whether a company can handle its longer-term financial obligations, not just what’s due next month.

    Debt -To-Equity Ratio

    Debt-to-equity tells you how much debt a company carries relative to the capital attributable to shareholders. A ratio of 0.5, for example, means the company carries roughly fifty cents of debt for every dollar of shareholders’ equity.

    But I wouldn’t use a universal number to decide whether leverage is good or bad. Capital-heavy industries like utilities, telecommunications, airlines, and manufacturing can have very different capital structures from software or other asset-light businesses.

    Instead, I’d ask whether leverage is increasing, whether earnings and cash flow are growing enough to support it, and how the company’s debt levels compare with competitors operating in the same industry.

    I come back to interest coverage a lot because it’s such a human question underneath the math: can this company comfortably handle the interest on what it owes?

    Interest Coverage Ratio

    Interest coverage is generally calculated as EBIT divided by interest expense. A coverage ratio of 5 means operating earnings cover interest expense roughly five times over, providing considerably more breathing room than a company sitting close to 1.

    When coverage gets close to 1, most of the company’s operating earnings are being consumed by interest expense. That leaves very little room for earnings to deteriorate before servicing the debt becomes much more difficult.

    Take two companies carrying identical debt loads. One has interest coverage of 8, the other 1.3. Looking only at the amount of debt might make them appear similar. Looking at their ability to service that debt tells a completely different story.

    Efficiency Ratios: How Well Is Management Running the Business?

    Most retail investors skip this category entirely, which is a shame, because it’s often where you can see the real difference between a well-run operation and one that’s starting to develop problems underneath the surface.

    Inventory turnover measures how many times a company sells through and replaces its inventory over a period. Higher turnover can point to strong demand and tight inventory management. Lower or declining turnover can mean inventory is building faster than it’s being sold.

    But when I see inventory turnover falling, I wouldn’t immediately conclude that demand has collapsed. I’d want to understand why. Are sales slowing? Is production running ahead of demand? Are certain products or SKUs accumulating? Is older inventory starting to build? Or did management deliberately increase inventory ahead of an expected increase in sales?

    The ratio tells you where to look. It doesn’t give you the entire answer.

    Asset turnover – revenue divided by average total assets – shows how much revenue a company generates from its asset base. It’s especially useful for comparing companies operating in similar businesses. If one competitor consistently generates more revenue from a comparable asset base, that’s something worth understanding.

    Receivables turnover tells you how efficiently a company collects money owed by customers. When this starts slipping, it can be an early warning sign.

    One thing I’d watch particularly closely is receivables growing significantly faster than revenue. If sales increase 10% while receivables jump 30%, I’d want to know why. Maybe customers are taking longer to pay. The company might have loosened its credit terms to support sales. Or maybe it’s simply timing. Whatever the explanation, it’s worth investigating before assuming that all revenue growth is equally healthy.

    Two manufacturers, same revenue. One turns inventory 12 times a year, the other 4. The first may be running leaner and tying up less cash in inventory. But even here, I wouldn’t immediately declare it the better business. Perhaps the second manufacturer needs more safety stock because of longer supply chains or a very different production model.

    That’s why context keeps coming back into the conversation.

    How to Read Financial Ratios Together

    Here’s what nobody really tells you when you’re first learning this stuff: no single ratio ever tells the whole story on its own.

    A great ROE means much less if it’s being driven by debt the company can’t comfortably sustain. Strong liquidity doesn’t tell you much about long-term value if the underlying business can’t generate acceptable returns. And fantastic revenue growth can hide deteriorating margins, rising receivables, accumulating inventory, or increasing leverage.

    The real skill – the thing that separates people who just glance at numbers from people who actually understand a business – is reading all four categories together, like four different witnesses describing the same event from four different angles.

    These days when I look at a company, I run through it almost automatically.

    • Is it profitable?
    • Can it cover its short-term obligations?
    • Is the debt manageable?
    • Is management using its assets and working capital efficiently?

    And then I look at the direction those numbers are moving.

    Because sometimes the ratio itself isn’t what catches my attention. It’s the trend.

    A current ratio of 1.4 might tell me very little on its own. But if it was 2.1 three years ago, then 1.8, then 1.6, and now 1.4, I want to know what changed.

    The same applies to margins, leverage, inventory turnover, receivables, and returns on equity.

    That’s why ratios work best when you compare them in three ways: against the company’s own history, against competitors, and against the economics of the industry it operates in.

    Ratios won’t tell you what the stock price does tomorrow. Nothing does.

    But they can tell you an enormous amount about the quality, financial health, and direction of the business you’re considering putting your money into.

    And that’s worth figuring out before you buy in, not after.

    Ultimately, learning how to read financial ratios means looking beyond today’s number and paying attention to the direction it’s moving.

    For investors who want to go back to the source, the U.S. Securities and Exchange Commission also provides a useful guide to reading financial statements and some of the ratios derived from them.

    Author

    Tabasum Imtiaz

  • How to Analyze a Cash Flow Statement Like a Professional Investor

    How to Analyze a Cash Flow Statement Like a Professional Investor

    Why Does the Cash Flow Statement Matters?

    Learning how to analyze a cash flow statement is one of the most valuable skills an investor can develop. Cash is the fuel that powers business growth, while profitability is a measure of performance. Although a company may report strong profits, it cannot invest in new projects, repay debt, or fund day-to-day operations without cash. That is why experienced investors pay close attention to the cash flow statement.

    While many investors focus only on profits, experienced investors know that the cash flow statement reveals whether a business is generating real cash to support future growth.

    Investors are often willing to pay a premium for companies with strong future growth prospects, and that growth depends on cash, not profitability alone. A profitable business can have a compromised growth if it struggles with cash required to fund new capital projects or it struggles with working capital to meet its day-to-day operations’ needs.

    An income statement calculates profitability whereas a Cash Flow statement explains how that profit was utilized, how much of that was turned into real cash. Public companies generally publish cash flow statements as part of their quarterly and annual financial reports. Understanding how to analyze a cash flow statement helps investors evaluate a company’s financial strength beyond reported profits.

    So what do we see in a Cash Flow statement?

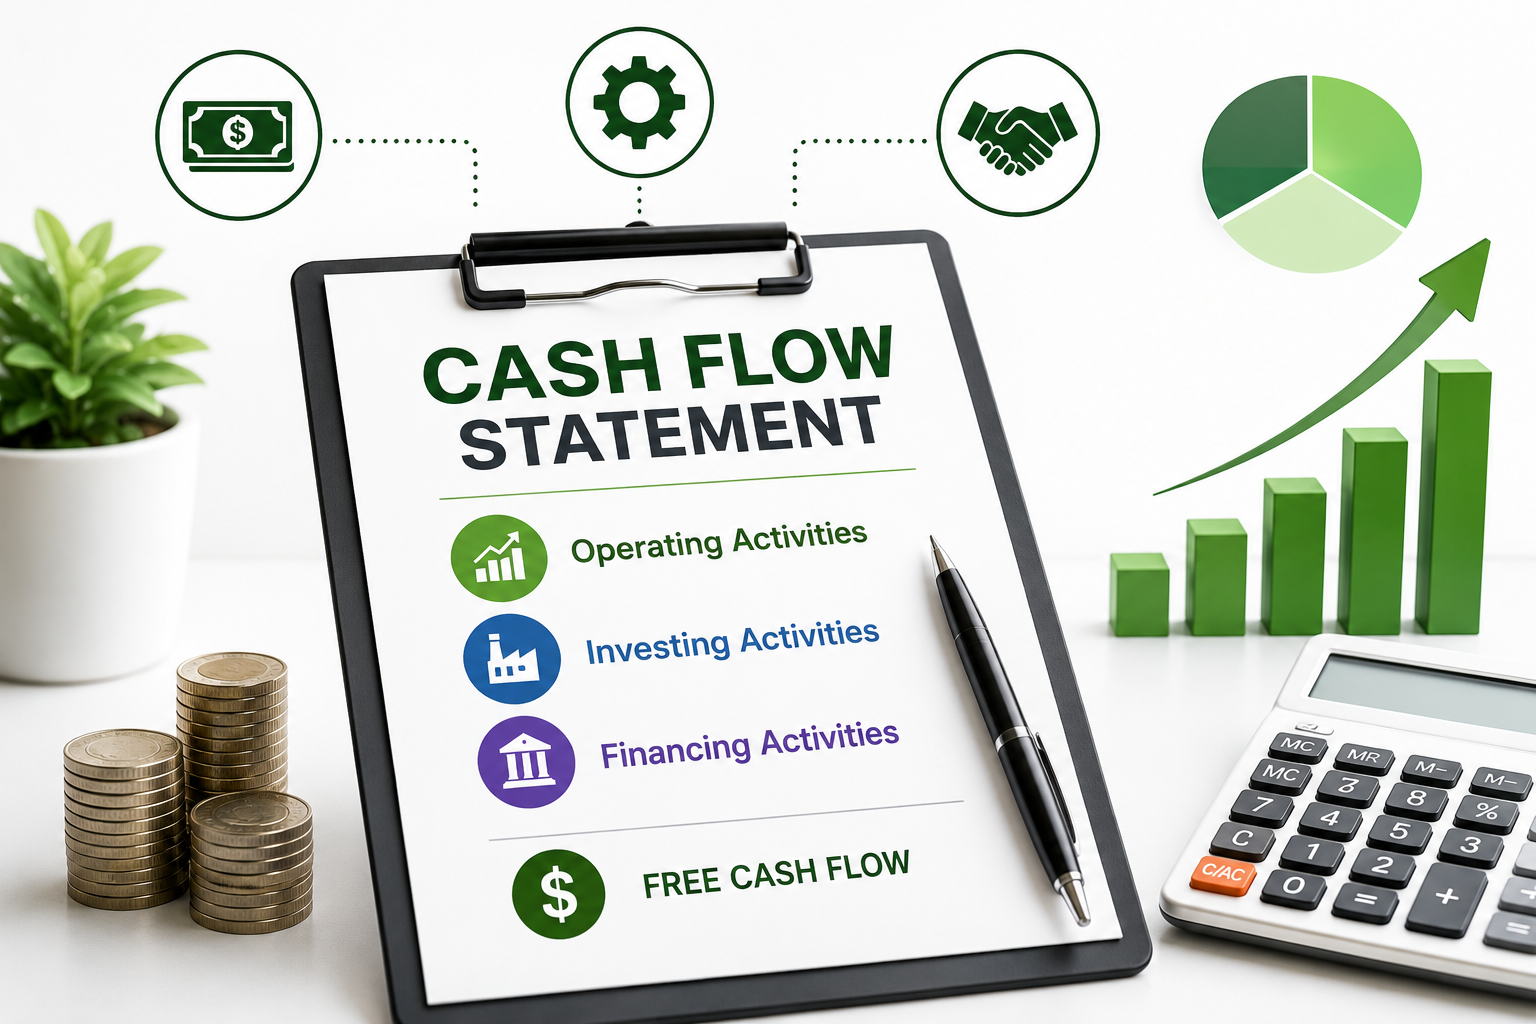
    A Cash Flow statement comes with three broad sections

    1. Cash Flow from Operating Activities

    2. Cash Flow from Investing Activities

    3. Cash Flow from Financing Activities

    Let’s dive into details for each of the above explained categories. Before analyzing a cash flow statement for investment decisions, it is important to understand how it is prepared.

    The starting point of any Cash Flow statement is the Net Income. Once a company reports net income on its income statement, the next step is to explain what happened with that net Income

    Since the Net Profit is calculated using accrual accounting, it is important to convert accruals to cash concept before starting Cash Flow statement

    Adjustments to Net Profit

    For this, Net Income is added back for all the deductions that are non cash in nature

    A few examples of those add backs are Accrued Interest, Amortization and depreciation of non current assets, any unrealized FX gains/losses as they are just accounting adjustments and have no real cash event linked to them. Once the adjustments are added back, we move to first section of cash flow statement which is cash flow from Operations

    Cash Flow from Operations

    Unlike accounting profit, cash from operations tells investors how much cash the core business actually generated during the period 

    In this section we adjust for working capital to remove the accrual impacts from the net Profit. Balance sheet statements are required to make these adjustments. For details on Balance sheet statements, check this article on Balance sheet statements for Investors

    Working capital includes Accounts Receivables, Accounts Payables, Inventory and some other deposits and prepayments. Because net income is prepared on accruals concept, cash needs to adjust for those assumptions. For example an increase in Receivables by $5m over a period is taken into account in profitability as Revenue but not all of that revenue is collected as cash. This means any increase in receivables needs to be subtracted from Net Income to subtract the uncollected Revenue already recorded in Profit. Any decrease in Receivables is taken as cash addition as it signals cash in, not recorded in profitability

    Similarly Accounts payables, inventory, prepaid expenses, deposits are treated as working capital adjustments. Once the adjustments are made, the resulting number is called “Cash from Operations” For an investor the simple interpretation is that the cash left over after business meets all its day-to-day working capital needs. If this cash is positive, it signals the business has enough room to use the remainder cash for capital projects or for financing needs. A negative Cash Flow indicates business is struggling to meet its day to day operations

    Cash Flow from Investing Activities

    This section includes all the cash used for capital investments. This could be like adding another project in a plant, acquiring a new production equipment, acquiring another business, buying intangible assets and selling assets.Investors analyze this section to understand how much the company is investing in future growth and whether those investments are being funded through internally generated cash or external financing.

    Cash Flow from Financing Activities

    Many businesses use financing for their growth. It could be debt financing increasing their leverage or capital financing by going public and issuing stocks to the general public which creates dilution of earnings. Share buy backs and dividend payments are also included here. All those events are recorded in this section which makes this section very important for investors to understand the financing structure of a business.

    How to Analyze a Cash Flow Statement

    Once you know how to analyze a cash flow statement, it becomes much easier to identify financially strong businesses.Investors review each section to understand the current cash utilisation and foreseeable future of the business. A growing operating Cash Flow indicates, not only stronger demand in terms of revenue but efficient Inventory management, collections of Receivables on time, paying suppliers efficiently to maximise supplier financing. The investment section shows how the management is handling investing activities. Does business operations generate enough cash and allows business growth through investments and if yes how much of that growth is coming from what type of financing. 

    The financing type used for growth indicates a business using debt financing or capital financing. This section helps investors assess how dependent a company is on debt or equity financing and whether its capital structure remains sustainable. An investor can see the management’s risk appetite when looking at investing and financing activities. Depending on the industry type, risk appetite can be justified for example in the Technology sector. Therefore , these metrics should always be benchmarked against the industry standards

    Free Cash Flow

    How to Analyze a Cash Flow Statement Like a Professional Investor

    Free Cash Flow refers to the cash remaining after a company generates cash from operations and pays for the capital expenditures needed to maintain or grow the business. It represents cash that can potentially be used to repay debt, pay dividends, repurchase shares, or invest in future opportunities.

    While it’s good to have a positive free Cash Flow indicating business still has the fuel available to meet future growth, having a huge reserve of free cash can sometimes signal a red flag. Cash sitting idle generates little or no return and gradually loses purchasing power due to inflation. Investors should therefore evaluate how effectively management allocates excess cash

    What are the possible Red Flags?

    It is essential for an investor to analyze Cash Flow statements in conjunction with other statements. A business with increasing profitability over time and lower operating Cash Flow for several consecutive years indicates a problem with working capital management.

    This means even if a business is generating good revenue with controlled costs, it is not collecting its receivables from the market on time, inventory management is poor, supplier payments are being made way before the due dates. A profitable business may not be able to survive in the foreseeable future if working capital is not managed well

    A business with negative operating Cash Flow and heavy borrowing increases the risk profile of the business. Borrowing comes with higher interest expense making covenant scrutiny more rigorous from banking partners.

    A Real World Example

    Apple Inc Cash Flow statement Year 2025

    Breakdown2025-09-30
    Operating Cash Flow$111.5 billion
    Investing Cash Flow$15.2 billion
    Financing Cash Flow$(120.7) billion
    End Cash Position$35.9 billion
    Income Tax Paid Supplemental$43.4 billion
    Capital Expenditure$(12.7) billion
    Issuance of Debt$4.5 billion
    Re Payment of Debt$(10.9) billion
    Re purchase of Capital Stock$(90.7) billion
    Free Cash Flow$98.8 billion

    Apple generated approximately $111.5 billion in cash from operating activities during fiscal 2025, demonstrating the company’s exceptional ability to convert its products and services into real cash. This strong operating cash flow comfortably funded approximately $12.7 billion in capital expenditures, leaving Apple with nearly $98.8 billion is free cash flow

    The company then returned a significant portion of this cash to shareholders through share repurchase of approximately $90.7 billion while also paying dividends. This is a classic example of a mature, highly profitable business generating more cash than it needs to operate and invest for future growth.

    Apple’s cash flow statement demonstrates why cash generation is one of the strongest indicators of financial quality. Despite already being one of the world’s largest companies, Apple continues to generate enough cash to invest in its business while returning substantial capital to shareholders.

    Key Take aways

    Learning how to analyze a cash flow statement allows investors to make better long-term investment decisions.

    • Cash is the lifeblood of every business.
    • Strong operating cash flow indicates a healthy core business.
    • Free cash flow provides flexibility for growth, debt repayment, dividends, and share buybacks.
    • Review operating, investing, and financing cash flows together for the complete picture.
    • Always compare the cash flow statement with the income statement and balance sheet before making investment decisions.

    Capital Lenses Insight

    A cash flow statement tells the story behind a company’s cash generation, investments, and financing decisions. While profits often receive the most attention, experienced investors know that cash ultimately determines whether a business can survive, grow, and create long-term shareholder value

    Tabasum Imtiaz

    August 6, 2026

  • How to Analyze a Balance Sheet Like an Investor?

    How to Analyze a Balance Sheet Like an Investor?

    Why Does a Balance Sheet Matter?

    Have you ever wondered how professional investors can look at a company’s balance sheet and quickly judge whether the business is financially strong?How to analyze a balance sheet is one of the most important skills every investor should learn.

    While many beginners focus only on revenue or profits, experienced investors know that the balance sheet often tells a much deeper story. It shows what a company owns, what it owes, and how much truly belongs to shareholders. Learning how to analyze a balance sheet allows investors to evaluate a company’s financial health before investing.

    Understanding a balance sheet allows investors to assess a company’s financial strength, liquidity, and long-term stability. It helps investors identify businesses that are financially strong and avoid companies that may appear successful on the surface but are quietly heading toward financial trouble.

    Every balance sheet follows one simple accounting equation:

    This equation tells us that every asset owned by a company has been financed either through borrowing (liabilities) or through shareholders’ investments and retained profits (equity).  

    Assets = Liabilities + Shareholders’ Equity

    This equation must always balance. Every dollar invested in assets has been financed either by creditors or by shareholders.

    Assets

    How to Analyze a Balance Sheet

    An asset is any resource that a company owns or controls and expects to generate future economic benefits from. Assets are divided into two broad categories: Current Assets and Non-current Assets. Current Assets and Non-current assets.If an asset is expected to generate economic benefits within the next 12 months, it is classified as a current asset. Inventory, cash, Account receivables (money owed to us by customers) are all current assets.

    Non-current assets generate economic benefits over many years rather than within the next 12 months. These include property, machinery, equipment, buildings, and intangible assets such as patents. It’s a non-current asset. For example Machinery and equipment used by a manufacturing company to manufacture products

    Liabilities

    Liabilities are financial obligations that a company owes to lenders, suppliers, employees, governments, or other parties. Like assets, Liabilities also have two categories. Current Liabilities are short term and obligation period is within one fiscal year. Account payables, tax payables are some of the examples for current liabilities

    How to Analyze a Balance Sheet

    Obligations spanning beyond one year are long term or non current liabilities. Loans or debts spanning more than a year are normally categorized here.

    Liabilities are not always bad. Many successful companies use debt to finance growth. The key question for investors is whether the company can comfortably repay those obligations.

    Equity

    Equity represents the shareholders’ ownership in the business after all liabilities have been deducted from total assets. It mainly consists of share capital (also referred to as book value) and retained earnings, which represent the cumulative profits or losses earned by the company over its history. Growing retained earnings over many years often indicate that management is successfully creating value for shareholders 

    Five Things Smart Investors Look for

    Once you understand how to analyze a balance sheet, you can quickly identify strengths and weaknesses in any company’s finances.

    Cash Position

    Cash provides flexibility. Companies with strong cash balances can invest during downturns, acquire competitors, repurchase shares, or weather unexpected economic challenges without relying heavily on debt

    Working Capital

    How to Analyze a Balance Sheet

    Current assets and current liabilities provide valuable insight into a company’s short-term financial health. Investors often calculate the Current Ratio (Current Assets ÷ Current Liabilities) to assess whether the business can comfortably meet its short-term obligations. Investors also examine inventory, receivables, and payables to understand how efficiently management converts working capital into cash.

    Debt Level

    Investors understand the debt level when looking at long term liabilities. Debt is a source of external financing to fund the projects/assets that a business uses to generate income. While it helps in expansion, it comes with financing cost and covenant reporting to the lender. A high debt level is not automatically a red flag. Investors should ask whether the company’s cash flow is sufficient to comfortably service interest and principal repayments. 

    A higher debt makes a higher gearing ratio (Debt/Equity) which makes a company risky. Acceptable debt levels vary significantly across industries. Capital-intensive businesses often carry more debt than software companies because they require large investments in equipment and infrastructure

    Inventory

    Inventory is the biggest area where much of cash is tied up from the working capital. Investors should monitor whether inventory is growing faster than sales. A significant increase in inventory may indicate slowing demand, overproduction, or potential inventory write-downs in the future. Investors should also compare inventory turnover over multiple years to identify improving or deteriorating operational efficiency. On the other hand, inventory growing in line with sales may simply indicate healthy business expansion.

    Equity

    Investors like to see shareholders’ equity growing consistently over time. Increasing retained earnings often indicate that a company is generating profits and reinvesting them back into the business, strengthening its financial position. Companies that consistently increase retained earnings while maintaining healthy returns on equity often create significant long-term value for shareholders.

    Example

    Lets demonstrate this using some numbers

    AssetsAmount
    Cash $120m
    Inventory$80m
    Equipment$400m
    Liabilities
    Long-term Debt$150m
    Equity
    Shareholders’ Equity$450

    Assets ($600M) = Liabilities ($150M) + Equity ($450M) 

    At first glance, this company appears financially healthy because it has a strong cash position, moderate debt, and positive shareholders’ equity. However, investors should always compare these numbers with previous years and with competitors in the same industry before making an investment decision.

    Important Financial Ratios Investors Use

    Here are some of the common ratios used by investors to evaluate before making investment decisions

    RatioFormulaGood Sign
    Current RatioCurrent Assets ÷ Current LiabilitiesAbove 1.5
    Debt-to-EquityTotal Debt ÷ EquityLower is generally better
    Return on Equity (ROE)Net Income ÷ EquityHigher is better
    Inventory TurnoverCOGS ÷ Average InventoryHigher usually indicates efficiency

    Common Beginner Mistakes

    Looking only at revenue

    Rapid revenue growth is exciting, but revenue alone does not create shareholder value. Investors should also examine profitability, margins, and free cash flow. While revenue is a good starting point, it’s the net income that gets added to shareholders value. A business with higher revenue growth prospects is still not worth if it cannot control its costs

    Ignoring Debt

    Businesses often use debt to invest in projects for their growth. Borrowing always carries risk, risk of non payment (Principal & interest). Sector wise debt level must be observed when assessing a company’s risk profile

    Confusing Cash with Profit

    How to Analyze a Balance Sheet

    This is very common where investors confuse cash with profit. Profit is calculated using accrual accounting (revenues and costs recorded when incurred not when received/paid) It is important to understand that reported revenue still needs an efficient AR system to turn that into cash. Account payable still needs to be efficient to use the best supplier financing. A struggling business from cashflow can still look very profitable when looking at Net Income.

    Ignoring Trend

    Investors should always analyse the historic trends. Looking at one year balance sheet numbers doesn’t offer much, however, analytical review helps them to compare against booming and low years

    Key Takeaways

    Knowing how to analyze a balance sheet helps investors avoid businesses with weak financial positions.

    • A balance sheet shows what a company owns, owes, and what belongs to shareholders.
    • Strong cash and manageable debt often indicate financial stability.
    • Working capital helps measure short-term liquidity.
    • Inventory and receivables reveal operational efficiency.
    • Compare several years of balance sheets rather than relying on a single reporting period.

    A balance sheet is much more than a list of assets and liabilities. It tells the financial story of a business and provides valuable insights into its stability, liquidity, and long-term strength. By learning how to analyse a balance sheet alongside the income statement and cash flow statement, investors can make more informed investment decisions.

    Professional investors rarely make decisions based on a single financial statement. By combining balance sheet analysis with income statement and cash flow analysis, investors gain a complete picture of a company’s financial health and long-term potential

    Mastering how to analyze a balance sheet is an essential step toward becoming a better long-term investor.

    Continue Learning

    If you enjoyed this article, continue with:

    Before analysing a balance sheet, it’s helpful to understand the basics of investing.

    Balance sheet analysis becomes even more powerful when combined with earnings reports.

    Tabasum Imtiaz

  • How to Read an Earnings Report Like a Professional Investor

    How to Read an Earnings Report Like a Professional Investor

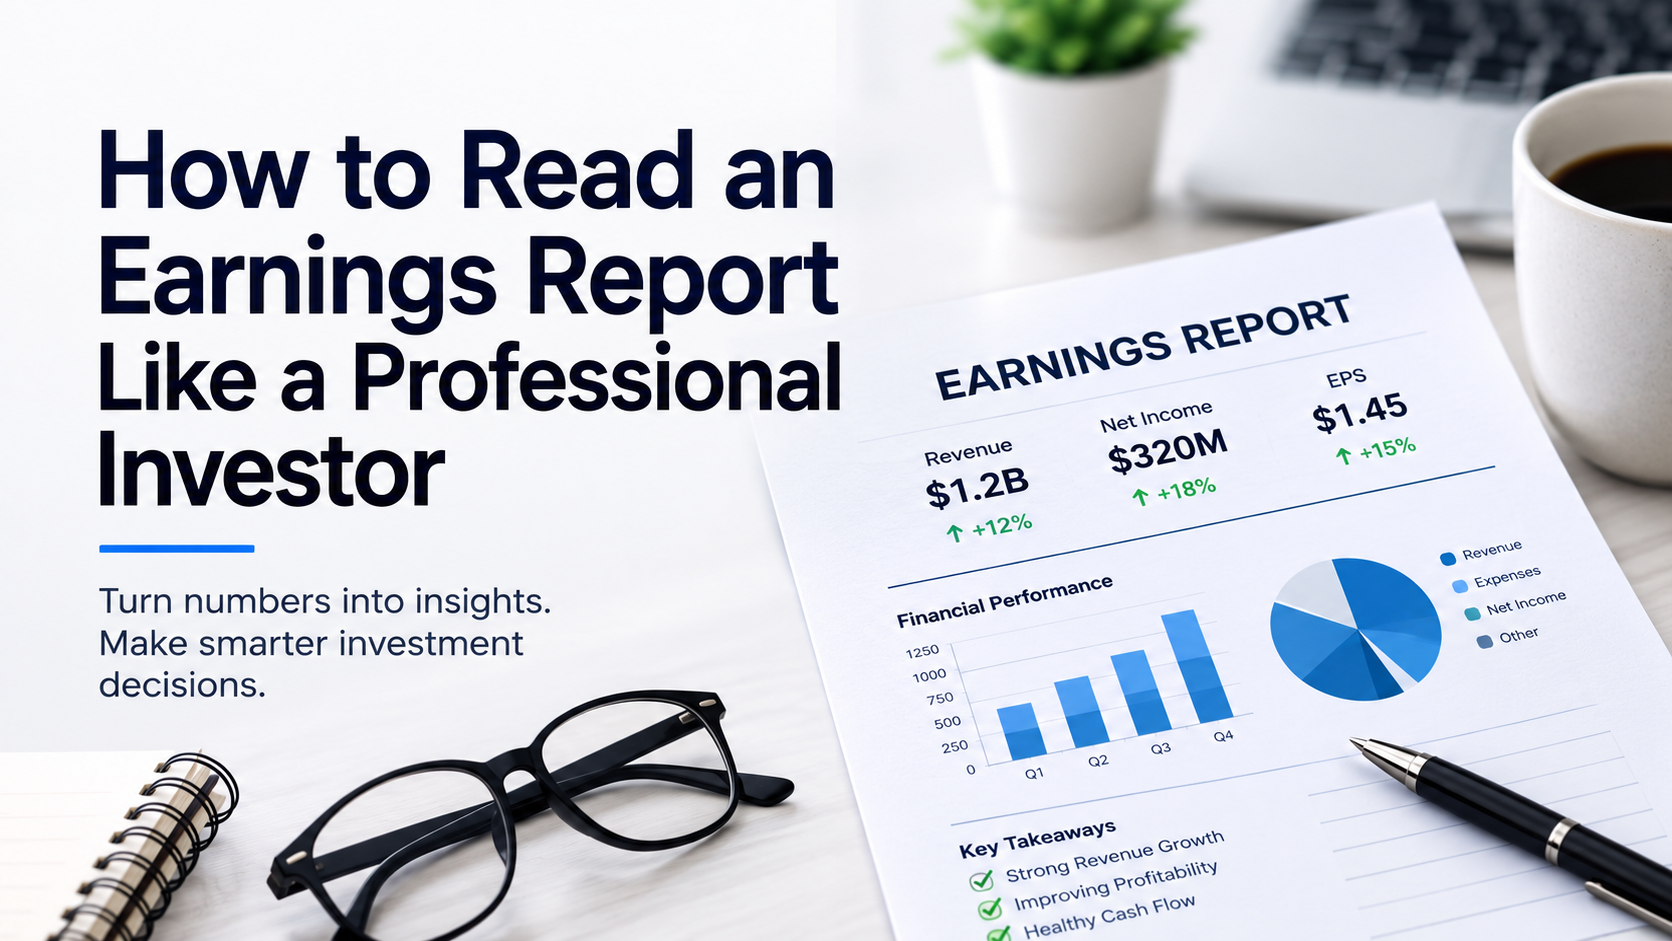
    How to read an earnings report illustration

    Have you ever wondered what makes stock prices move? Every day, share prices rise and fall based on a variety of factors. One of the most important drivers is a company’s earnings report. Publicly listed companies release quarterly and annual earnings reports to provide investors with an update on their financial performance and future outlook. If you’re new to investing, I recommend first reading our Investing in Stocks: A Beginner’s Guide to Building Long-Term Wealth. It explains the fundamentals of investing before showing you how to read an earnings report. Understanding both concepts will help you make more informed investment decisions.

    What is an Earnings Report?

    An earnings report is a financial update that publicly listed companies release every quarter (every three months) and annually at the end of their fiscal year. These reports summarize a company’s financial performance and provide investors with valuable insights into its future prospects, opportunities, and potential risks.

    Most publicly listed companies publish their earnings reports in the Investor Relations section of their websites. Investors can also access official company filings through the SEC’s EDGAR database (for U.S. companies) or SEDAR+ (for Canadian companies).

    Learning how to read an earnings report is an essential skill for every investor. Once you understand the key financial metrics, evaluating a company’s financial performance becomes much easier.

    Key Metrics Every Investor Should Understand

    MetricWhat it tells you
    RevenueIs the business growing?
    Gross MarginIs the company becoming more efficient? 
    Operating MarginIs management controlling operating costs? 
    Net IncomeIs the company profitable? 
    Free cash flowIs the business generating real cash? 
    EPSHow much profit belongs to each Share
    GuidanceWhat management expects next 

    How to Read an Earnings Report: What Investors Should Look For

    Investors should review Revenue growth compared with management guidance and the same quarter of the previous year.

    EPS growth shows profit per share unit and helps investors compare different businesses. A rising EPS over time indicates a healthy, growing business. Gross Margin is another important measure for investors as it indicates how well a business is managing its gross costs with  

    Revenue growth alone does not generate shareholders’ value, it’s the residual that is tied to shareholders’ wealth. Similarly Operating Income is another important metric. When Sales, general and admin expenses are taken into account, Gross margin becomes Operating Income. An improved Operating income indicates how well a business manages its operating expenses.

    Last but not the least, Free Cash flow measure. Cash is king. Even profitable businesses can fail if they are unable to generate sufficient cash to fund operations, invest in growth, or meet their financial obligations. Net Income tells what a business has earned , but free cash flow explains how much of that income is converted to actual cash. 

    A statement of cash flow shows how strong a business is in its operations which is essentially the life of business. It also shows how much of the remainder is used for investments and financing. A healthy free cash flow indicates the future success of the business and is a very important factor when making investment decisions.

    Why Does Future Guidance matter?

    Future guidance and stock price expectations

    Many novice investors keep an eye on earning reports and past financial results.It is important to remember that a stock’s market price reflects expectations of future earnings, not just past financial performance. Therefore, management forward-looking guidance has a significant impact on the share price. Investors should pay close attention to management’s guidance, as it often has a greater impact on share price than the reported results themselves.

    A Real-World Example

    Lets see the above theory using an example. Imagine stock price of a company is $300, EPS is $8.27, Revenue grew by 12.76% to $450 billion, Gross Margin expanded to 48%, Operating Profit 32% and Net Income reached $122billion

    Here is how I would evaluate the company

    A nearly 13% increase for a company already generating $450 billion is exceptional.

    Gross Margin = 48%

    This means:

    For every $100 of sales,

    • $48 remains after paying production costs.
    • $52 was spent producing the product.

    A 48% gross margin is very strong for most industries.

    If last year it was 45% and now it’s 48%, that’s even better because the company is becoming more efficient.

    Operating Margin = 32%

    This means after:

    • salaries
    • marketing
    • administration
    • R&D

    The company still keeps $32 out of every $100 sold.

    That’s excellent.

    It shows management is controlling expenses

    Net Income = $122 billion

    Now we know the company isn’t just selling more.

    It is actually converting those sales into cash profits.

    Net Margin

    = 122 / 450

    = 27.1%

    Meaning every $100 sold becomes $27 profit.

    EPS = $8.27

    EPS tells us how much profit belongs to one share.

    By itself it doesn’t tell us if the stock is expensive.

    That’s where valuation comes in.

    Price = $300

    EPS = $8.27

    P/E = Price ÷ EPS

    = 300 / 8.27

    = 36.3

    What does a P/E of 36 mean?

    It means investors are paying $36.30 for every $1 of annual earnings.

    The next question becomes: 

    Does this company deserve such a premium?

    This is a fantastic business with:

    • strong revenue growth,
    • expanding margins,
    • high profitability,
    • excellent earnings quality.

    The only caution is valuation. At a P/E of about 36, investors are already paying a premium, so much of the optimism may already be reflected in the share price.

    A strong company is not always a strong investment at today’s price. If future earnings continue to grow rapidly, today’s valuation could be justified. If growth slows, the stock could decline even while the business itself remains excellent.

    Common Mistakes Beginners make

    Common mistakes beginner investors make

    Many new investors rely on profitability reports and ignore cash positions of the business which is the main energy source for growth. Stock price also moves with market sentiment and headlines which temporarily creates volatility. Reacting to such headlines means locking in losses on temporary movements

    Before making any investment decision, ask yourself the following questions: 

    • Is revenue growing?
    • Is profit growing?
    • Is cash flow positive?
    • Is debt manageable?
    • Is management optimistic?

    Key Takeaways

    Key takeaways from reading an earnings report
    • Revenue tells you if the business is growing.
    • Margins tell you how efficiently it operates.
    • Cash flow tells you if profits are real.
    • EPS measures earnings available to shareholders.
    • Future guidance often matters more than past results.

    Capital Lenses Take

    An earnings report is more than a collection of financial numbers—it tells the story of a company’s performance, financial health, and future direction. Knowing how to read an earnings report can help investors make informed decisions based on business fundamentals rather than short-term market noise.

    Enjoyed this article? Follow Capital Lenses for practical investing education, market insights, and step-by-step guides designed to help you become a more informed investor.

    Disclaimer

    The information provided in this article is for educational and informational purposes only and should not be considered financial, investment, tax, legal, or professional advice.
    Capital Lenses does not make recommendations to buy, sell, or hold any security or investment. All investments involve risk, including the potential loss of principal. Before making any investment decisions, conduct your own research and consider consulting a qualified financial advisor who can assess your individual circumstances.
    While we strive to provide accurate and up-to-date information, no guarantee is made regarding the completeness, accuracy, or reliability of the content. Any reliance you place on the information provided is solely at your own risk.

    Written by

  • Investing in Stocks: A Beginner’s Guide to Building Long-Term Wealth

    Investing in Stocks: A Beginner’s Guide to Building Long-Term Wealth

    Imagine putting money into a savings account every month for 30 years, only to discover it bought less than you expected because inflation quietly eroded its purchasing power. That’s why investing has become one of the most important financial skills of our time.

    Why Investing Matters?

    Investing is important because it helps preserve your purchasing power, which is continually reduced by inflation (general price increase annually). In simple terms, a $100 bill cannot buy you the same goods or services in one year time that you can buy today. For example, if you can afford to buy a sandwich for $5 today. The same sandwich would cost you $5.5 next year. The additional 50c is the inflation. If you have money sitting in a chequing account, it will simply lose its buying power if not invested.

    How to deal With Inflation?

    To counter inflation, investment can be used to offset the impact. Imaging getting an average return of 8% on investment with the annual inflation rate at 3% would leave your wealth 5% surplus. An additional advantage of investing is the power of compounding. For example, if you invest $1000 and earn a 10% return, your investment grows to $1,100 after one year. If you earn another 10% the following year, your return is calculated on $1,100 rather than the original $1000, increasing your investment to $1,210. Over many years, this compounding effect becomes one of the most powerful drivers of wealth creation.

    Beyond Inflation: Building Long-Term Wealth

    This pattern creates a passive income channel which might not be scalable at first but after being consistent in first few years can turn into something significant. Many people enjoy a comfortable retirement life after being consistent in their investment habits. Some people do so well that they achieve financial freedom even before retirement. You could be one of them. You just need to start, and the truth is that everybody starts from somewhere. First step is always the hardest part, but you can’t achieve unless you take it.

    Where to Invest?

    Congratulations! You are already thinking about investing. That’s a significant first step. Next question is where to invest?

    Well, there are many options available in market depending on people’s risk profile. One way of investing is by owning a “Stock” or a “Share”. In simple terms, it’s a little portion of large company. It comes with a face market value which buyers are willing to pay. For example, if you buy one share of Micron Technology, you become a part-owner of the company. As Micron’s financial performance, market sentiment, and future expectations change, the value of your investment may rise or fall.

    Risk & Reward go together

    Remember, to understand the risk return relationship. There is always a risk when investing in stocks when the value is dependent on so many market variables. How do we manage that risk? The answer is “Diversification”. Not all companies come with the same return and reward relationship. The higher the reward, the higher the volatility. One way of achieving diversification is by investing in multiple sectors. Stock performance varies by sectors at a given time. People often build a “portfolio” which essentially is a mix of stocks from different sectors. If one sector underperforms for example financial, technology on the other hand may be performing strongly. This is the approach that many seasoned investors take as it requires continuous market knowledge

    Choice for a new Investor – Individual Stocks v ETFs?

    The safest approach for a new investor is to buy “ETFs” which means Exchange traded funds. One ETF is a group of many stocks from different market managed by professional fund managers, so investor doesn’t have to research every day. Owning an ETF comes with diversification benefit from experience fund manager but they come with a small fee, often called MERs, management expense ratios which is small % fee and value for money

    Where do I go to buy the stocks & ETFs?

    No, you do not have to go to the company to buy stocks directly from corporations, I know that’s what you were thinking. Instead, investors use a brokerage platform that acts as an intermediary between buyers and sellers in the stock market. Often Big bank offers this service, but they are normally expensive per trade. Many standalone brokers like Questrade, Wealthsimple in Canada offer zero commission trades

    Time in the Market Beats Timing the Market

    One of the biggest mistakes beginners make is waiting for the “perfect” time to invest. Even experienced investors cannot consistently predict short-term market movements. Rather than trying to buy at the absolute bottom, many successful investors focus on investing regularly and staying invested over the long term.

    Final, Investing Is a Marathon, not a Sprint – Successful investing isn’t about predicting tomorrow’s market movement. It’s about understanding the fundamentals, diversifying your investments, staying patient, and remaining disciplined through market ups and downs. Nobody can predict the future moves in the market, history has shown that disciplined, long-term investing has rewarded patient investors over decades.

    Capital Lenses Take

    Investing isn’t about finding the next stock that doubles overnight. It’s about building knowledge, developing discipline, and giving your money time to grow. The earlier you begin, the more time you give compound growth to work in your favor.

    Frequently Asked Questions

    How much money do I need to start investing?

    Many brokerage platforms now allow you to start with relatively small amounts. The most important step is building the habit of investing consistently rather than waiting until you have a large sum.

    Should I invest every month?

    Regular investing, often called dollar-cost averaging, helps reduce the impact of short-term market fluctuations and builds discipline over time.

    About the Author

    Tabasum Imtiaz is a finance professional with over a decade of experience in financial planning, manufacturing finance, budgeting, operational finance & capital markets. Through Capital Lenses, he explains investing and financial markets in a clear, practical way to help readers make more informed financial decisions.