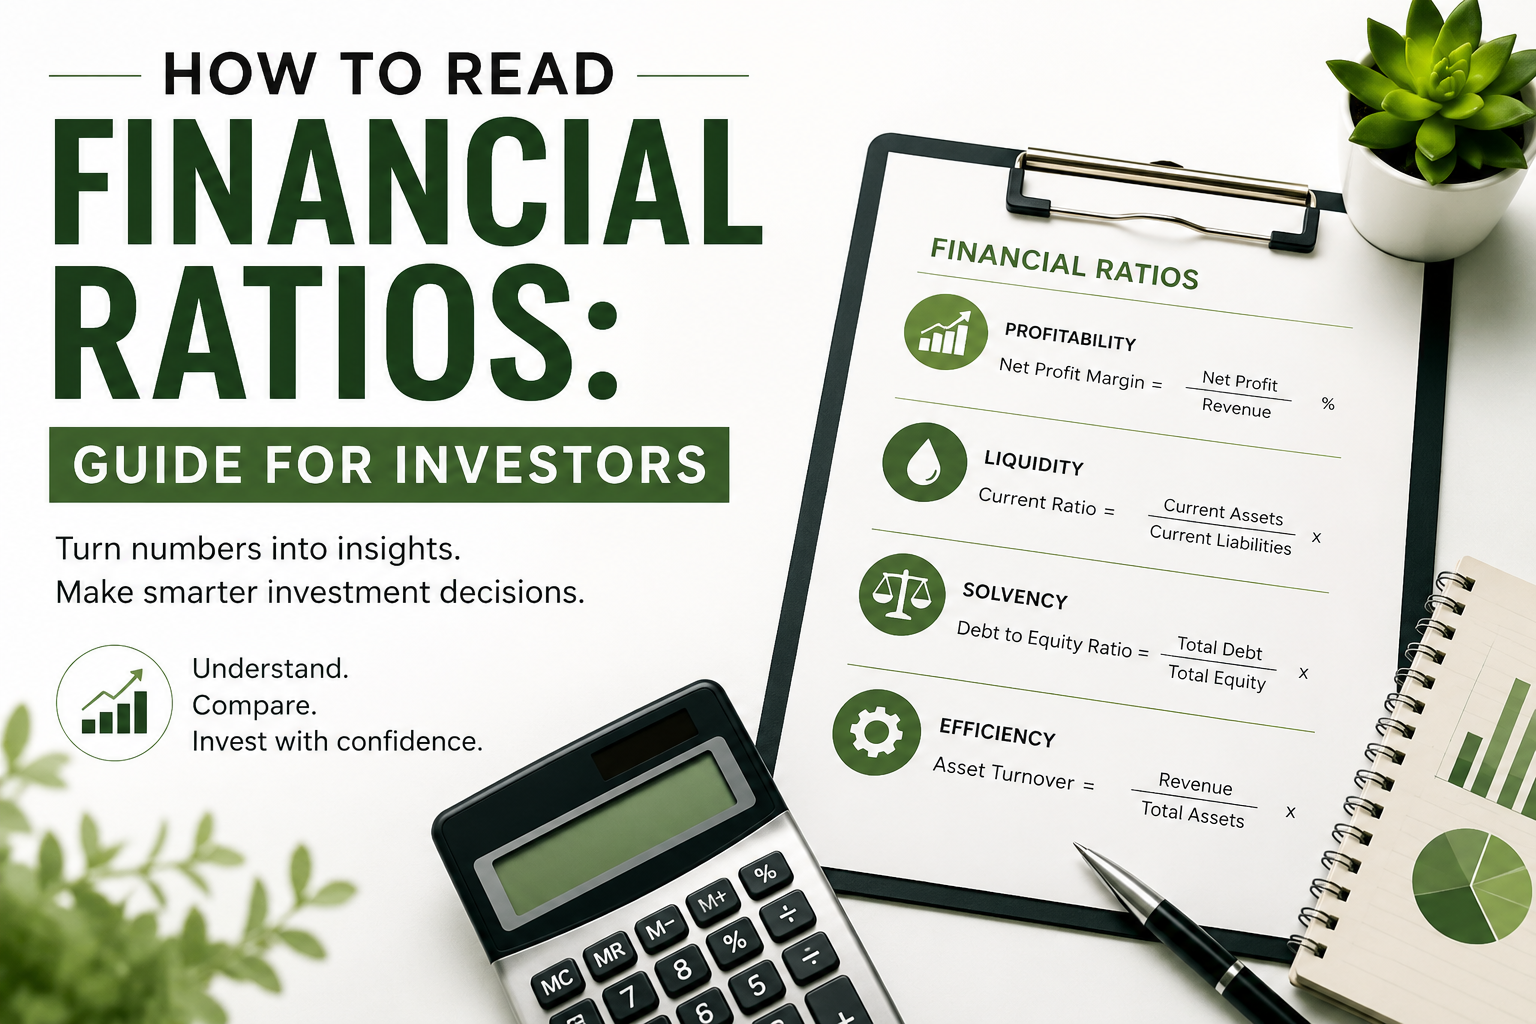
Learning how to read financial ratios isn’t really about memorizing formulas. It’s about understanding what those numbers are trying to tell you about the business.Years ago, someone handed me a stack of financial statements and said, “just run the ratios and tell me what you think.” I remember staring at that page for a good ten minutes, completely lost. Numbers everywhere. No story. No idea where to even start.
The easiest way to learn how to read financial ratios is to stop looking at them individually and start asking what each group tells you about the business.
It took me a while, honestly – years working inside finance teams, closing books month after month, sitting across from executives who wanted the two-minute version of a problem, not the twenty-page one – before ratios stopped feeling like a math test and started feeling like something closer to a conversation. The company is telling you something. You just have to know which numbers to listen to.
Once that clicked, everything got easier. So here’s my attempt to save you a few of those years. Four categories, some real examples, and none of the textbook jargon that made this stuff so painful to learn in the first place.
Profitability Ratios: Is the Business Actually Making Money?
Let’s start here because it’s the fun one, the one everyone gravitates toward first. Fair enough – we all want to know if a company is printing cash or just printing headlines.

Gross Profit
Gross profit margin is your starting point. It’s what’s left once you strip out the direct cost of whatever the company sells. Don’t get too excited or too worried by the raw number on its own though. A software company sitting at 80% margins and a grocery chain at 25% aren’t in some kind of race against each other. They’re just different businesses with completely different cost structures. Context does most of the heavy lifting here.
Net Profit
Then there’s net profit margin, which is really the number that keeps finance people up at night. This is what survives after everything gets paid – salaries, interest, taxes, the new coffee machine somebody approved without asking. A company can look fantastic on revenue and still produce very little bottom-line profit if this figure is thin or, worse, negative.
Return on Equity
My personal favorite is return on equity. It cuts straight to what shareholders actually want to know: for every dollar of shareholders’ equity sitting in the company, how much profit is the business generating?
A consistently strong ROE can be a sign of an excellent business, but this is one ratio where you need to look underneath the surface. High ROE can also be created by heavy borrowing or a relatively small equity base. That’s why I wouldn’t judge ROE on its own – I’d look at the company’s leverage and compare its ROE with its own history and with similar businesses.
Here’s a quick way to picture the difference. Say two companies each pull in $10 million in revenue. One runs a 5% net margin, the other 15%. Same size on paper, totally different animals underneath. That second company is converting far more of its sales into profit. The next question is why – stronger pricing power, better cost discipline, a different product mix, or perhaps a fundamentally better business model.
Liquidity Ratios: Can It Survive the Next Few Months?
Profitability tells you whether a business is making money. Liquidity tells you whether it can comfortably meet its short-term obligations. I’ve watched companies that looked perfectly healthy on the income statement run into real trouble simply because they couldn’t cover what was due in the short term. Profit and cash are two different things, and this is exactly where that gap gets tested.

Current Ratio
The current ratio is the simplest place to check. It’s current assets divided by current liabilities. If it dips under 1.0, that’s worth investigating – it means, on paper at least, the company has fewer current assets than current liabilities.
But don’t treat 1.0 as some magical dividing line between a healthy company and a troubled one. Some businesses can operate comfortably with relatively low current ratios because they generate predictable cash, collect from customers quickly, or turn inventory extremely fast. What matters is the nature of the business, its historical trend, and how it compares with similar companies.
Quick Ratio
The quick ratio (some people call it the acid-test) is the stricter version. It pulls inventory out of the equation because inventory isn’t always something you can turn into cash on short notice, especially if it’s sitting in a warehouse instead of moving out the door. This ratio is really asking one thing: if liquidity got tight, could the company handle its short-term obligations without relying heavily on selling inventory?
Picture a retailer heading into a slow stretch with a current ratio of 1.8 but a quick ratio sitting at just 0.6. That gap is telling you something real – a large part of that liquidity cushion is inventory rather than cash or receivables. That isn’t automatically bad for a retailer, but if sales start slowing while inventory keeps building, I’d want to understand what’s happening.
Solvency Ratios: Is the Debt Load Sustainable?
This one plays out over years, not quarters. It becomes particularly important when rates climb or the economy turns. Solvency ratios are about whether a company can handle its longer-term financial obligations, not just what’s due next month.
Debt -To-Equity Ratio
Debt-to-equity tells you how much debt a company carries relative to the capital attributable to shareholders. A ratio of 0.5, for example, means the company carries roughly fifty cents of debt for every dollar of shareholders’ equity.
But I wouldn’t use a universal number to decide whether leverage is good or bad. Capital-heavy industries like utilities, telecommunications, airlines, and manufacturing can have very different capital structures from software or other asset-light businesses.
Instead, I’d ask whether leverage is increasing, whether earnings and cash flow are growing enough to support it, and how the company’s debt levels compare with competitors operating in the same industry.
I come back to interest coverage a lot because it’s such a human question underneath the math: can this company comfortably handle the interest on what it owes?
Interest Coverage Ratio
Interest coverage is generally calculated as EBIT divided by interest expense. A coverage ratio of 5 means operating earnings cover interest expense roughly five times over, providing considerably more breathing room than a company sitting close to 1.
When coverage gets close to 1, most of the company’s operating earnings are being consumed by interest expense. That leaves very little room for earnings to deteriorate before servicing the debt becomes much more difficult.
Take two companies carrying identical debt loads. One has interest coverage of 8, the other 1.3. Looking only at the amount of debt might make them appear similar. Looking at their ability to service that debt tells a completely different story.
Efficiency Ratios: How Well Is Management Running the Business?
Most retail investors skip this category entirely, which is a shame, because it’s often where you can see the real difference between a well-run operation and one that’s starting to develop problems underneath the surface.
Inventory turnover measures how many times a company sells through and replaces its inventory over a period. Higher turnover can point to strong demand and tight inventory management. Lower or declining turnover can mean inventory is building faster than it’s being sold.
But when I see inventory turnover falling, I wouldn’t immediately conclude that demand has collapsed. I’d want to understand why. Are sales slowing? Is production running ahead of demand? Are certain products or SKUs accumulating? Is older inventory starting to build? Or did management deliberately increase inventory ahead of an expected increase in sales?
The ratio tells you where to look. It doesn’t give you the entire answer.
Asset turnover – revenue divided by average total assets – shows how much revenue a company generates from its asset base. It’s especially useful for comparing companies operating in similar businesses. If one competitor consistently generates more revenue from a comparable asset base, that’s something worth understanding.
Receivables turnover tells you how efficiently a company collects money owed by customers. When this starts slipping, it can be an early warning sign.
One thing I’d watch particularly closely is receivables growing significantly faster than revenue. If sales increase 10% while receivables jump 30%, I’d want to know why. Maybe customers are taking longer to pay. The company might have loosened its credit terms to support sales. Or maybe it’s simply timing. Whatever the explanation, it’s worth investigating before assuming that all revenue growth is equally healthy.
Two manufacturers, same revenue. One turns inventory 12 times a year, the other 4. The first may be running leaner and tying up less cash in inventory. But even here, I wouldn’t immediately declare it the better business. Perhaps the second manufacturer needs more safety stock because of longer supply chains or a very different production model.
That’s why context keeps coming back into the conversation.
How to Read Financial Ratios Together
Here’s what nobody really tells you when you’re first learning this stuff: no single ratio ever tells the whole story on its own.
A great ROE means much less if it’s being driven by debt the company can’t comfortably sustain. Strong liquidity doesn’t tell you much about long-term value if the underlying business can’t generate acceptable returns. And fantastic revenue growth can hide deteriorating margins, rising receivables, accumulating inventory, or increasing leverage.
The real skill – the thing that separates people who just glance at numbers from people who actually understand a business – is reading all four categories together, like four different witnesses describing the same event from four different angles.
These days when I look at a company, I run through it almost automatically.
- Is it profitable?
- Can it cover its short-term obligations?
- Is the debt manageable?
- Is management using its assets and working capital efficiently?
And then I look at the direction those numbers are moving.
Because sometimes the ratio itself isn’t what catches my attention. It’s the trend.
A current ratio of 1.4 might tell me very little on its own. But if it was 2.1 three years ago, then 1.8, then 1.6, and now 1.4, I want to know what changed.
The same applies to margins, leverage, inventory turnover, receivables, and returns on equity.
That’s why ratios work best when you compare them in three ways: against the company’s own history, against competitors, and against the economics of the industry it operates in.
Ratios won’t tell you what the stock price does tomorrow. Nothing does.
But they can tell you an enormous amount about the quality, financial health, and direction of the business you’re considering putting your money into.
And that’s worth figuring out before you buy in, not after.
Ultimately, learning how to read financial ratios means looking beyond today’s number and paying attention to the direction it’s moving.

Author
Tabasum Imtiaz